Quickstart Tutorial
In this Quickstart you will:
- Get a taste of how Pelorus captures a change going through the application's delivery cycle.
- Understand that Pelorus should be used as a conversation tool to read the trends in metrics and react by making informed investments in the software delivery process.
- Use GitHub as the Hosting Service for Version Control System (used by commit time exporter) and as the Issue Tracker System (used by failure exporter).
To do so, you will
- Install Pelorus Operator in an OpenShift cluster
- Create Pelorus instance to monitor a sample application
- Install a sample application that Pelorus will measure
- Create new commits and issues for the sample application
- Watch as the metrics and trends change as new versions roll out
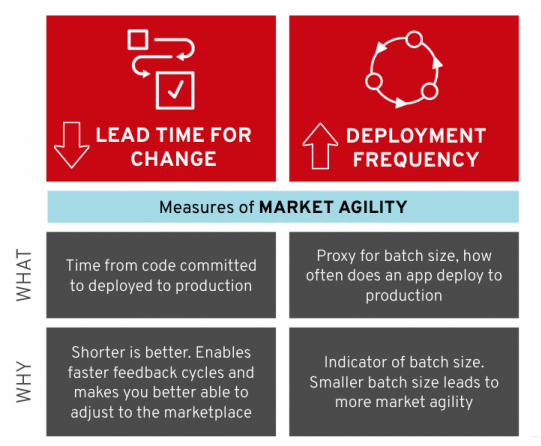
Note: More information about the four key DORA metrics can be found in our Outcomes documentation
Note: We recommend reading our Pelorus Overview to get familiar with some basic concepts and terminology.
Prerequisites
Tools and access
To successfully go through this demo you will need:
-
GitHub account with a Personal access token generated.
-
Access to an OpenShift 4.7 or higher cluster via OpenShift web console and shell.
-
Shell with the following CLI:
GitHub project fork
- The first step is to Fork our repository with sample application to your personal GitHub space. Use the link below that opens a "new Fork" page:
IMPORTANT: From now on
<your_org>used in this document will be your GitHubusernamewhere themig-demo-appswas forked and should replace thekonveyorpart of the URL.
- The Mean Time to Restore and Change Failure Rate part of this demo uses GitHub Issues provider, so enable the Issues in the forked repo under the settings page:
-
https://github.com/
<your_org>/mig-demo-apps/settings#features
Pelorus Operator
Deployment of the running Pelorus Operator instance consists of two steps:
- Installing Pelorus Operator
-
- Creating Pelorus instance
- This step requires a configuration file, so let's start with this it first.
Prepare Config file
NOTE: A comprehensive list of all configuration options is available in our Pelorus Core and Pelorus Exporters documentation.
For this demo we will need to prepare a configuration file that will be used in our deployment. For now it's enough to understand that our Pelorus Deployment will consist of:
- The pelorus instance:
- is named pelorus-quickstart
- Pelorus will deploy three exporters:
- deploytime to watch
mongo-persistentnamespace - committime to watch
mongo-persistentnamespace - failure to monitor our application failures logged in the Forked GitHub project. For this step you need to adjust the configuration file to match the
<your_org>and GitHub Personal access token.
- deploytime to watch
Let's create the Pelorus Configuration file and save it under the pelorus-quickstart.yaml file. Please adjust the <your_github_api_token> and <your_org>:
apiVersion: charts.pelorus.dora-metrics.io/v1alpha1
kind: Pelorus
metadata:
  name: pelorus-quickstart
spec:
  exporters:
    instances:
    - app_name: deploytime-exporter
      exporter_type: deploytime
      extraEnv:
      - name: NAMESPACES
        value: mongo-persistent
    - app_name: committime-exporter
      exporter_type: committime
      extraEnv:
      - name: NAMESPACES
        value: mongo-persistent
    - app_name: failure-exporter
      exporter_type: failure
      extraEnv:
      - name: PROVIDER
        value: github
      - name: TOKEN
        value: <your_github_api_token>
      - name: PROJECTS
        value: <your_org>/mig-demo-apps
Installing Pelorus Operator
Please follow Pelorus Operator installation documentation available via two methods:
- (recommended) Using OpenShift Command Line Tool
- Using OpenShift web console
Creating Pelorus instance
Once the Pelorus Operator is installed now it's time to use our pelorus-quickstart.yaml file from the Prepare Config file step to create Pelorus Instance that will monitor our sample application. Detailed instructions are outlined in one of two methods:
- (recommended) Using OpenShift Command Line Tool
- Using OpenShift web console
At this stage you should see number of pods running. Please confirm that all pods are healthy by running CLI command $ oc get pods -n pelorus to continue with this tutorial. If there is any pod in Error or CrashLoopBackOff state, this tutorial may fail at any further step:
$ oc get pods -n pelorus
NAME                                                   READY   STATUS      RESTARTS        AGE
committime-exporter-1-7zvmp                            1/1     Running     0               2m10s
committime-exporter-1-deploy                           0/1     Completed   0               2m13s
deploytime-exporter-1-deploy                           0/1     Completed   0               2m13s
deploytime-exporter-1-hrnqq                            1/1     Running     0               2m10s
failure-exporter-1-deploy                              0/1     Completed   0               2m13s
failure-exporter-1-r55lp                               1/1     Running     0               2m10s
grafana-deployment-65765d5594-9vmqx                    2/2     Running     0               2m14s
grafana-operator-controller-manager-bf759cf9b-4gxxl    2/2     Running     0               2m58s
pelorus-operator-controller-manager-8455c65d76-b5z7k   1/1     Running     0               2m45s
prometheus-operator-6fdc9c5494-ggwwk                   1/1     Running     0               2m49s
prometheus-prometheus-pelorus-0                        3/3     Running     1 (2m10s ago)   2m14s
prometheus-prometheus-pelorus-1                        3/3     Running     1 (2m9s ago)    2m14s
Accessing Pelorus dashboard
To view the Pelorus measurements we need to gain access to its' Grafana dashboard. To get the URL of the Grafana dashboard use the following command:
$ oc get route grafana-route --namespace pelorus -o=go-template='https://{{.spec.host | printf "%s\n" }}'
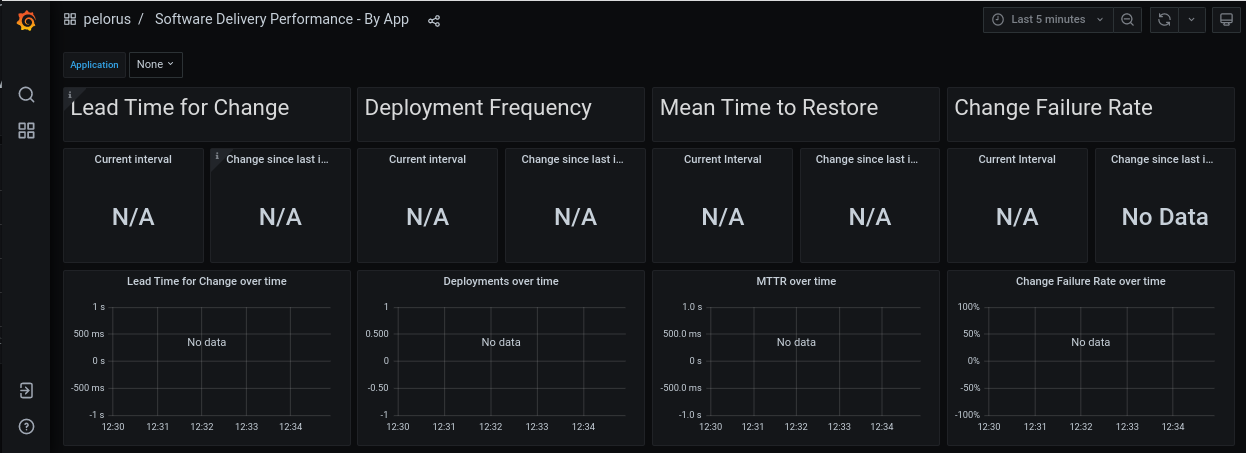
In the Grafana dashboard navigate to search and select "pelorus ➔ Software Delivery Performance - By App". An empty dashboard without any measurements should be presented. That is expected, because we did not deploy our sample application yet!
Congratulations
Pelorus is now configured to measure the sample application.
It is time to deploy the sample application to view measurements from Pelorus' Grafana dashboard. Please keep the Grafana page open.
Sample Application Demo
Lead Time for Change and Deployment Frequency
In this section you see how Pelorus measures two DORA metrics: Lead time for change and Deployment frequency.
Install the sample application
Clone your forked copy from the GitHub project fork step:
# Adjust <your_org> to your GitHub fork org:
$ export GITHUB_FORK_ORG=<your_org>

$ git clone git@github.com:${GITHUB_FORK_ORG}/mig-demo-apps.git
Install the todolist-mongo-go sample application in your OpenShift cluster:
# Adjust <your_org> to your GitHub fork org:
$ export GITHUB_FORK_ORG=<your_org>

$ cd mig-demo-apps/apps/todolist-mongo-go
$ sed -i "s/your_org/${GITHUB_FORK_ORG}/g" mongo-persistent.yaml
$ oc create -f mongo-persistent.yaml
The todolist application and mongo database should now build and deploy into the mongo-persistent namespace.
Wait for the application, by waiting for the ready state of the pod which is labeled app=mongo:
Ensure that your BuildConfig points correctly to your URI value from your GitHub fork, by running:
$ oc get buildconfig.build.openshift.io/todolist --namespace mongo-persistent -o=go-template='URI value: {{.spec.source.git.uri | printf "%s\n"}}'
View the Pelorus measurements
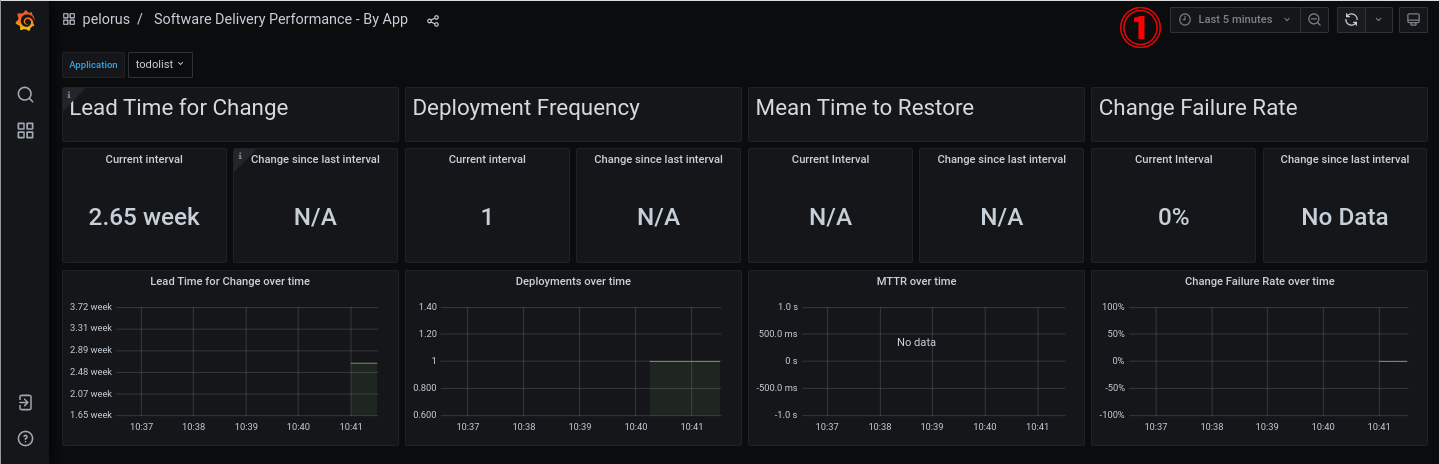
After a couple of minutes you should see at least one measurement for Lead Time for Change and Deployment Frequency in the Grafana dashboard, like in the following image:
Note: If the time elapsed from your
mongo-persistentdeployment is higher then 5 minutes, you may want to adjust different relative time range ⓵ e.g. Last 3 hourss.
Update application
In this section we will observe application continuous delivery and analyze it with Pelorus. Few steps will guide us through this process:
- Setting up GitHub Webhook that allows to automatically run new builds of your sample applications when the commit to the source code happens
- Fixing an issue in the running application and update the application source code
- Committing changes to source control
- Watching the application redeploy with the changes to be captured by Pelorus
Github Webhook
You can easily watch how Pelorus works by automatically building and deploying the todolist app when a commit is pushed to Github by utilizing Github's webhooks.
To get the build webhook URL you can navigate to the todolist BuildConfig details or by running
# Get the secret that is used by the Webhook
$ WEBHOOK_SECRET=$(oc get bc/todolist -o=jsonpath='{.spec.triggers..github.secret}' -n mongo-persistent)

# Verify the secret that is used by the Webhook
$ echo "${WEBHOOK_SECRET}"

# Get the Webhook URL that will be used in GitHub
$ oc describe buildconfig.build.openshift.io/todolist --namespace mongo-persistent | grep 'webhooks/<secret>/github' | sed "s/<secret>/${WEBHOOK_SECRET}/g"
To add the webhook to your forked GitHub repo:
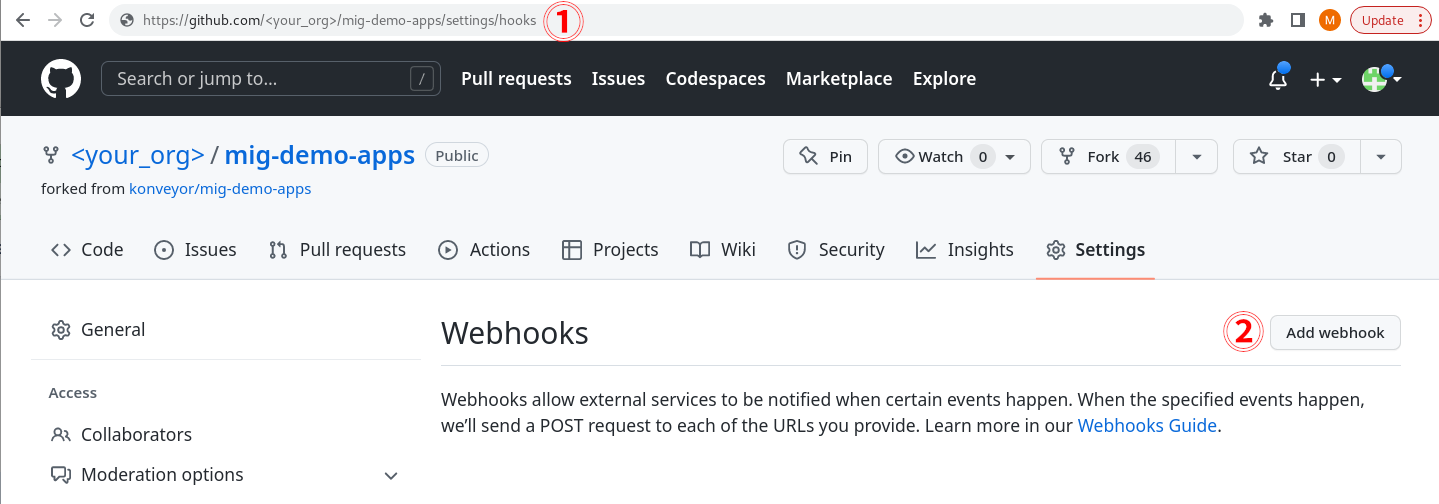
- ⓵ Navigate to https://github.com/
<your_org>/mig-demo-apps/settings/hooks - ⓶ Click Add webhook in the right top corner
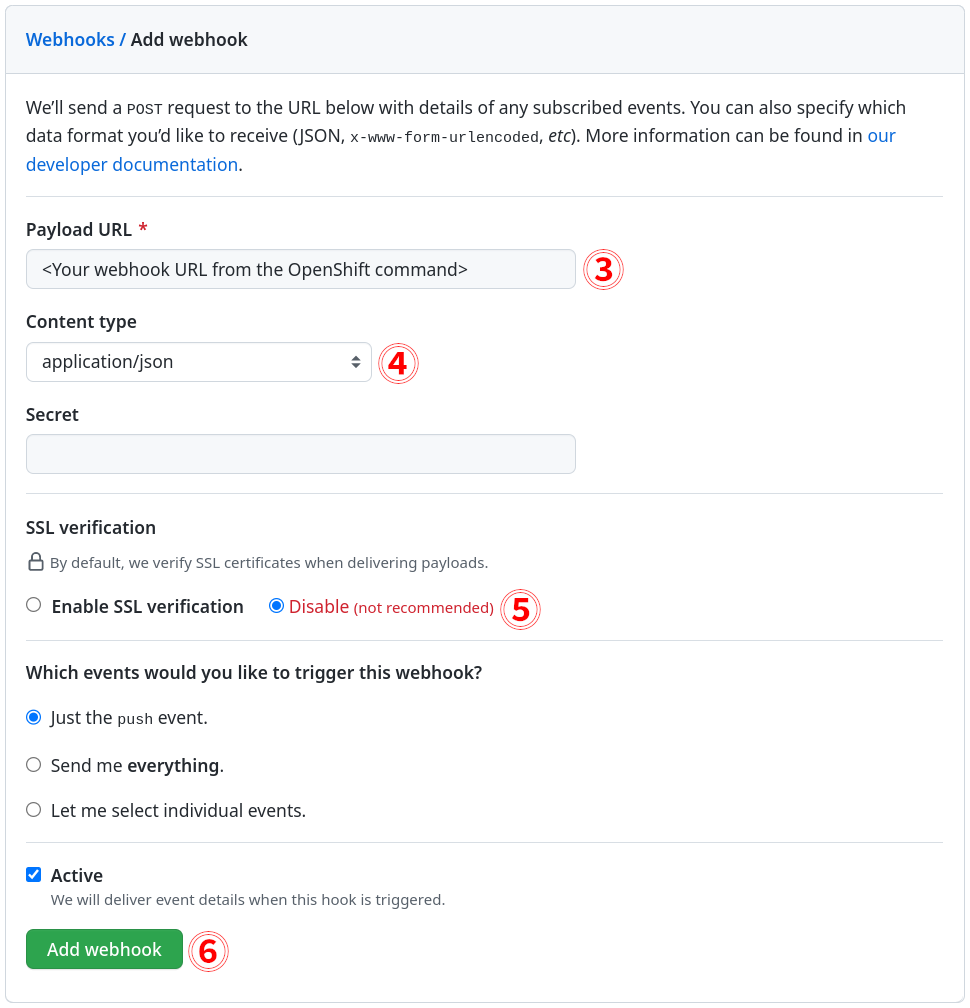
- ⓷ Paste the Webhook URL from the previous
occommand in the Payload URL - ⓸ Select content type application/json
-
- ⓹ Toggle SSL as needed.
- For this quickstart tutorial consider Disable, as you may not have signed SSL Certificate in your testing OpenShift environment and the webhook will fail to deliver it's payload with the error:
We couldn’t deliver this payload: x509: certificate signed by unknown authority.
- ⓺ Click Add webhook
Now your webhook should be added and green success icon should appear left to your webhook's URL, which means it successfully sent the first ping payload to your OpenShift URL endpoint:
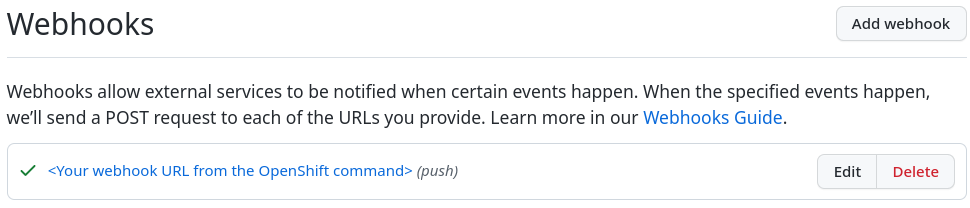
For more information, consult GitHub's documentation.
Update the application source code
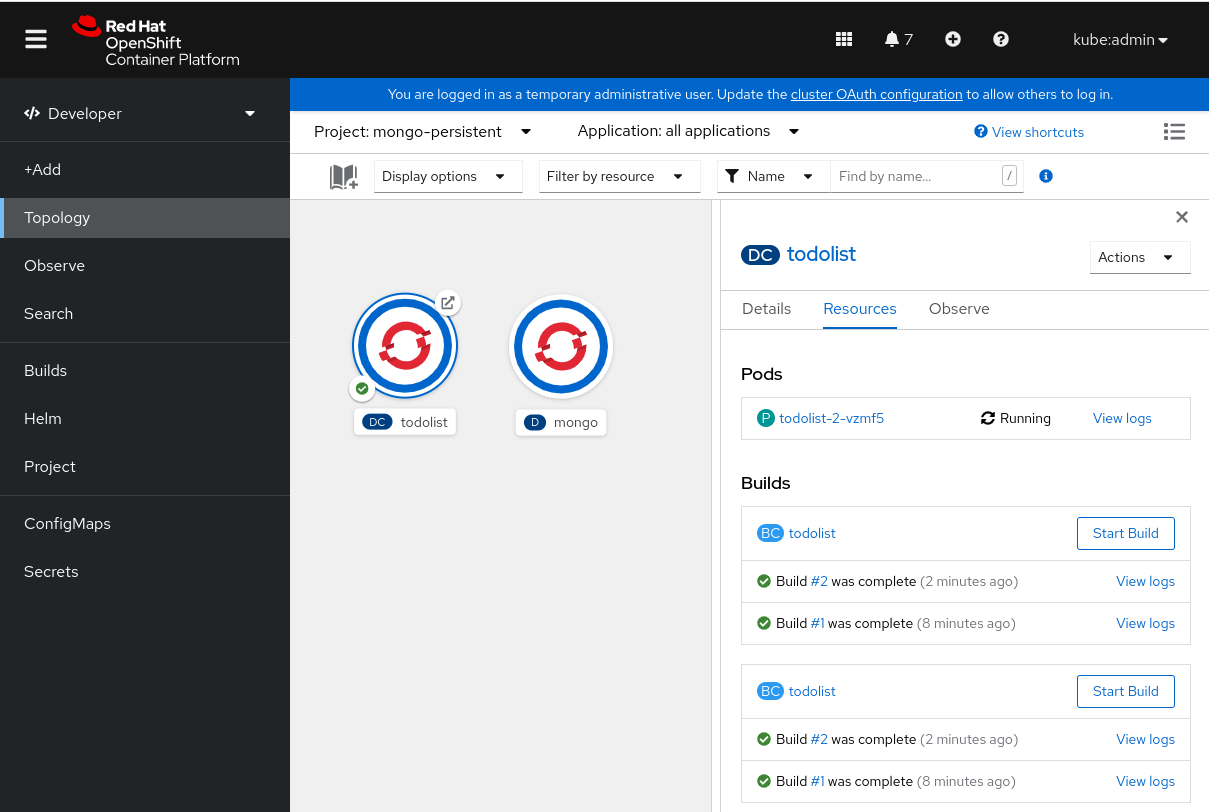
In your OpenShift mongo-persistent project page, open the link to the sample application or get the link, by running
$ oc get route todolist-route --namespace mongo-persistent -o=go-template='http://{{.spec.host | printf "%s\n" }}'
The application should look like in the following image:
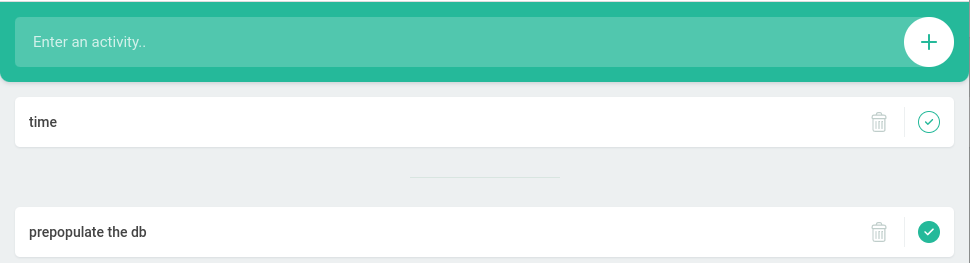
The text "Enter an activity" does not seem clear, let's change that to "Add a todo item", by running:
If you are happy with the change, commit it and push to the default master branch:
Once the commit is pushed to the repository, it will automatically rebuild because we have setup the GitHub webhook.
You will now see that the todolist application starts to rebuild, like in the following image:
Or by running the oc get build command and checking the new todolist-2 build in the output:
$ oc get build -n mongo-persistent
NAME         TYPE     FROM          STATUS     STARTED         DURATION
todolist-1   Docker   Git@e27a21e   Complete   8 minutes ago     1m42s
todolist-2   Docker   Git@8c045a2   Complete   2 minutes ago     1m37s
After it finishes, you can refresh your todolist application web page and see the running instance of our sample application has updated "Add a todo item" text:

Understand the changes to the Grafana Dashboard
After few minutes navigate in the Grafana dashboard to "pelorus ➔ Software Delivery Performance - By App" and set the interval to 15 minutes.
Pelorus will now read the updated commit and register a new deploytime.
You should see a total of 2 deployments, like in the following image:
Note: The suggested interval range of
15 minutesmay vary as you may have committed your change in different time interval from the first sample application deployment.
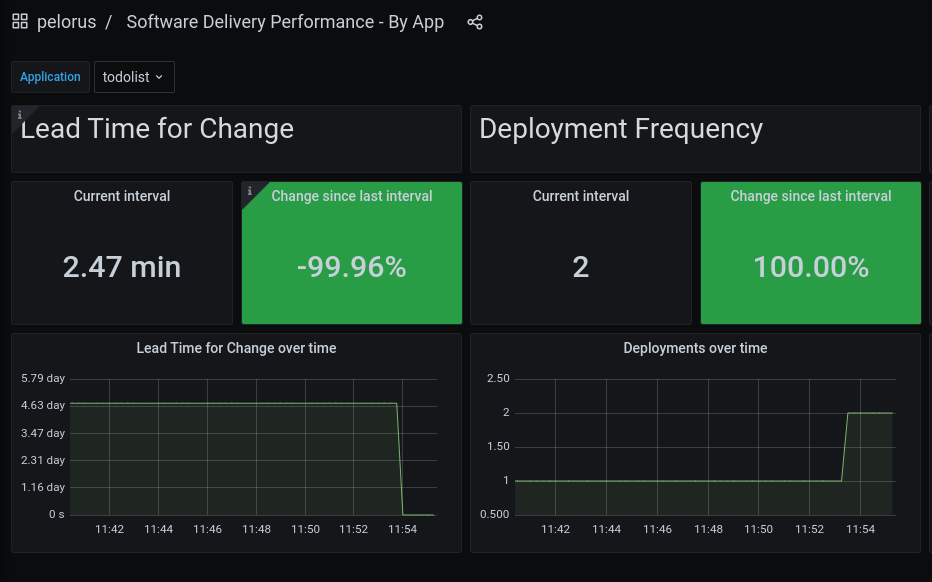
The Lead Time for Change should initially go down as we just pushed a commit. The time difference between changes to the original git repository and your personal forked repo will most likely cause this metric to go down.
There have been two deployments since this demonstration was started, the initial deployment and now the redeployment after pushing a change to the git repository. The Deployment Frequency should have gone up by 100% in the last 15 minutes. Once your initial deployment time is longer than 15 minutes in the past, you will find your interval has fallen by 50%.
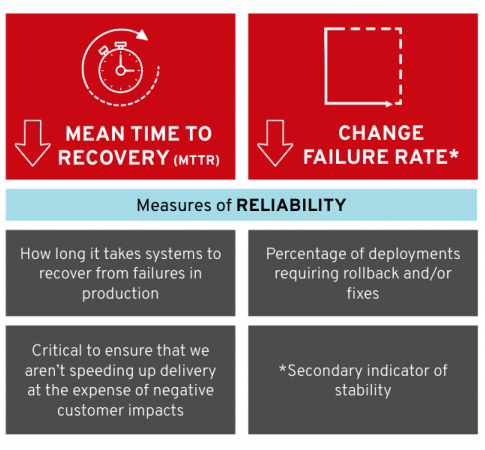
Mean Time to Restore and Change Failure Rate
In this section you see how Pelorus measures the last two DORA metrics: Mean time to recovery and Change failure rate.
Pelorus failure exporter
Creating Pelorus instance step should gave you a running instance of the failure exporter.
Check that no bugs are found by Pelorus in its' failure exporter, by ensuring no lines starting with the failure_creation_timestamp are present in the output of the following command:
$ curl $(oc get route failure-exporter --namespace pelorus -o=template='http://{{.spec.host | printf "%s\n"}}')
GitHub Issues
Prepare GitHub labels
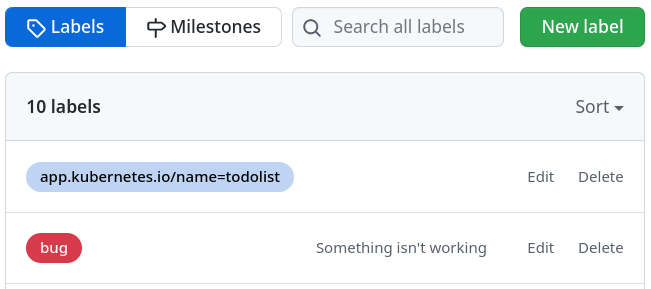
Pelorus will utilize two labels to determine if a GitHub issue is associated with our todolist mongo application:
-
bug- We'll need the default
buglabel as explained in the GITHUB_ISSUE_LABEL.
-
app.kubernetes.io/name=todolist- Additionally, by default Pelorus requires that all issues associated with a particular application be labeled with the
app.kubernetes.io/name=<app_name>label. This works the same way as the deployment configuration and forfailureexporter it's explained in the APP_LABEL configuration option.
Note: Only those GitHub issues which have both labels are recognized by Pelorus as a critical bugs in our "production" environment.
- Ensure the above labels are present and create them in the event of their absence by navigating to the following URL, like in the following image:
-
https://github.com/
<your_org>/mig-demo-apps/labels
Create New GitHub issue
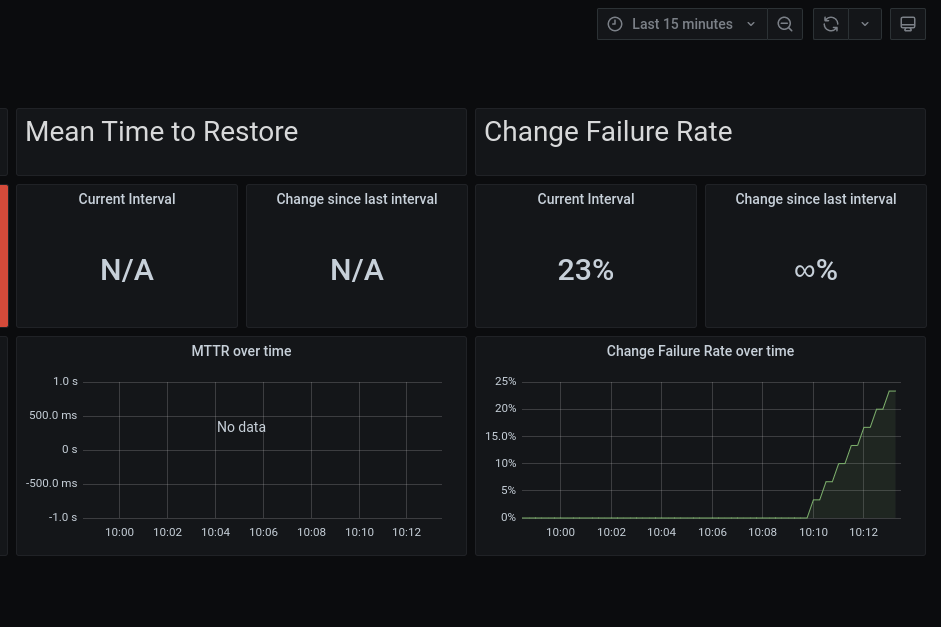
Create a Github issue and label it with bug and app.kubernetes.io/name=todolist to register a failure, like in the following image (our application name is set as todolist):
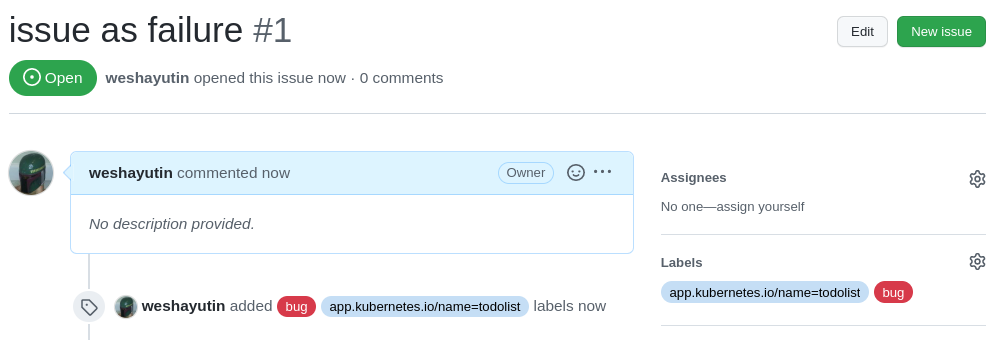
Refresh the Grafana dashboard and you should see the Change Failure Rate go up. We will discuss what it means in the Understand the changes to the Grafana Dashboard section.
Resolve GitHub issue
Now, let's resolve previously created GitHub issue by closing it and see how that impacts our Failure Rate and the Mean Time to Restore.
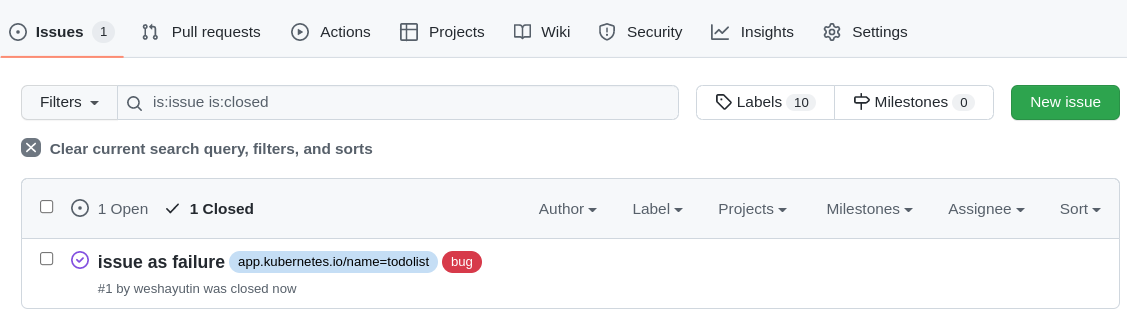
Ensure your issue is resolved by selecting Closed link in the GitHub's Issues page:
You may also check the output from the failure exporter again, by running:
$ curl $(oc get route failure-exporter --namespace pelorus -o=template='http://{{.spec.host | printf "%s\n"}}')
At this time you should see lines starting with failure_creation_timestamp and failure_resolution_timestamp. They indicate the time the issue was created and when it was closed.
Understand the changes to the Grafana Dashboard
Now, we should also have data in the Mean Time to Restore metric in Grafana dashboard, like in the following image.
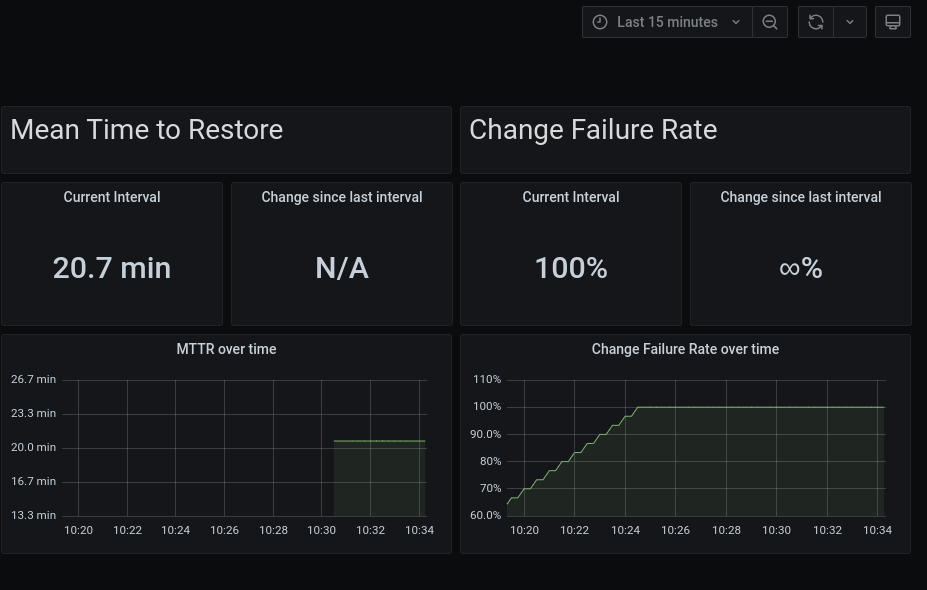
Mean Time to Restore measures how long it takes to restore the service when an incident occurs.
Change Failure Rate is a key quality metric that measures what percentage of changes fails in the production environment. It is crucial to have alignment on what constitutes a failure. The recommended definition is a change that either results in degraded service or subsequently requires remediation.
Cleanup
Uninstalling sample application
To uninstall the sample application, run:
Uninstalling Pelorus
Uninstalling Pelorus Instance
To uninstall the Pelorus instance together with Prometheus and Grafana instances, run:
Uninstalling Operators
Uninstalling Pelorus Operator will not uninstall its' dependent operators such as Grafana Operator and Prometheus Operator from your cluster, so you need to remove those independently.
Depending on the installation method which you have used during Installing Pelorus Operator step, please remove all three of them by using OpenShift web console:
- Pelorus Operator
- Prometheus Operator
- Grafana Operator
Or using oc delete to delete subscription and csv objects:
# Get the ClusterServiceVersion names to be deleted from the pelorus namespace
$ oc get csv --namespace pelorus
NAME                        DISPLAY               VERSION   REPLACES                    PHASE
grafana-operator.v4.8.0     Grafana Operator      4.8.0     grafana-operator.v4.7.1     Succeeded
pelorus-operator.v0.0.2     Pelorus Operator      0.0.2     pelorus-operator.v0.0.1     Succeeded
prometheusoperator.0.47.0   Prometheus Operator   0.47.0    prometheusoperator.0.37.0   Succeeded

# Delete the CSV with their versions from the pelorus namespace
$ oc delete csv --namespace pelorus grafana-operator.v4.8.0
$ oc delete csv --namespace pelorus pelorus-operator.v0.0.2
$ oc delete csv --namespace pelorus prometheusoperator.0.47.0

# Delete subscription objects from the pelorus namespace
$ oc delete subscription --namespace pelorus \
    grafana-operator-v4-community-operators-openshift-marketplace \
    pelorus-operator \
    prometheus-beta-community-operators-openshift-marketplace