Overview
To deploy Pelorus to monitor your application(s), the following information are needed:
- The OpenShift Namespace(s) your application(s) is(are) deployed.
- The Git Provider(s) information (name, credentials, etc) your application(s) source code(s) is(are) hosted.
- The Issue Tracker(s) information (name, credentials, etc) your application(s) uses.
With this information gathered, Pelorus can be deployed following the steps.
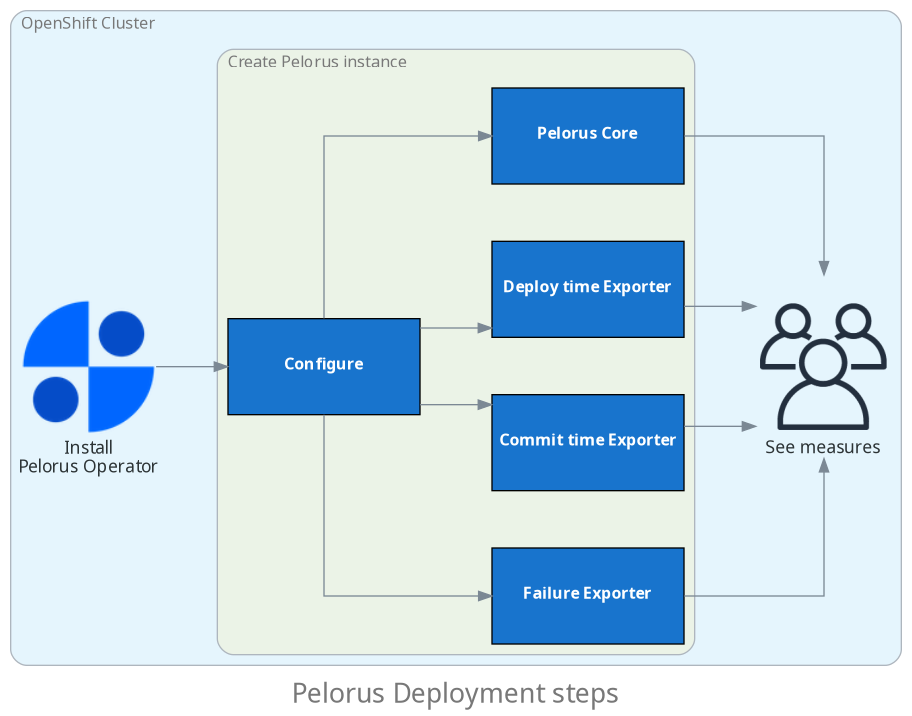
For more information on each step, check Installation, Core's Configuration and Exporters' Configuration documentation.
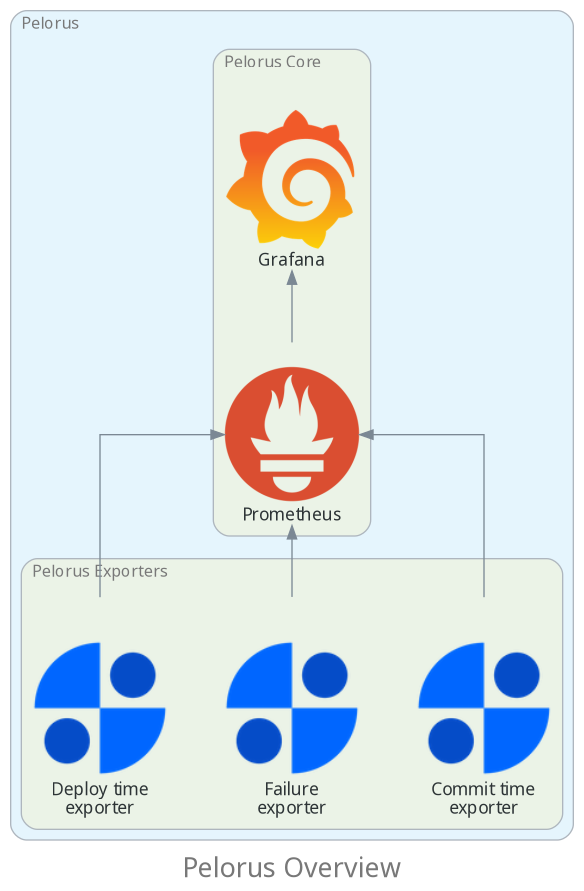
Visualization
Pelorus is composed of Prometheus, Grafana and exporters. It can be easily deployed to an OpenShift cluster and provides an organizational-level view of critical measures.
Further knowledge on Pelorus architecture
Terminology
- Instance: The set of Pelorus Core and Exporters objects.
- Pelorus Core: The integration layer between Prometheus, Grafana and exporters.
- Pelorus Exporter: The metrics collector.
- Provider: The tools from where Pelorus Exporters collect the metrics.
- Metric: The data that is used to generate a measure.
- Measure: The outcome to make better decisions based on it.
Supported Providers
List of providers supported by Pelorus.
Open an issue or a pull request to add support for additional providers!
Deployment
- OpenShift
Git Providers
- GitHub
- Bitbucket
- Gitea
- GitLab
- Azure DevOps
Issue Trackers
- Jira
- GitHub
- ServiceNow
- PagerDuty
- Azure DevOps