Installation
There are three methods to deploy Pelorus, plus there is an option to deploy Pelorus exporters only:
First two are using Pelorus Operator that is available by default in the Red Hat-provided community-operators catalog sources. This catalog is distributed as part of the OpenShift:
- OpenShift Web console
- OpenShift Command Line Tool
Deploying separate Pelorus exporters
- Helm3 charts to deploy separate Pelorus exporters
(Deprecated) Helm3 charts method is used for development of Pelorus only:
Prerequisites
Before deploying Pelorus, the following tools are necessary
-
Access to an OpenShift 4.7 or higher cluster via Web console or CLI.
-
CLI access requires a machine from which to run the install with an oc The OpenShift CLI*
-
Helm charts requires additional tools on your system:
Note: It is possible to install
ocandhelminside a Python virtual environment. To do so, change to Pelorus directory (after cloning its repository), and run
OpenShift Web console
Installing Operator
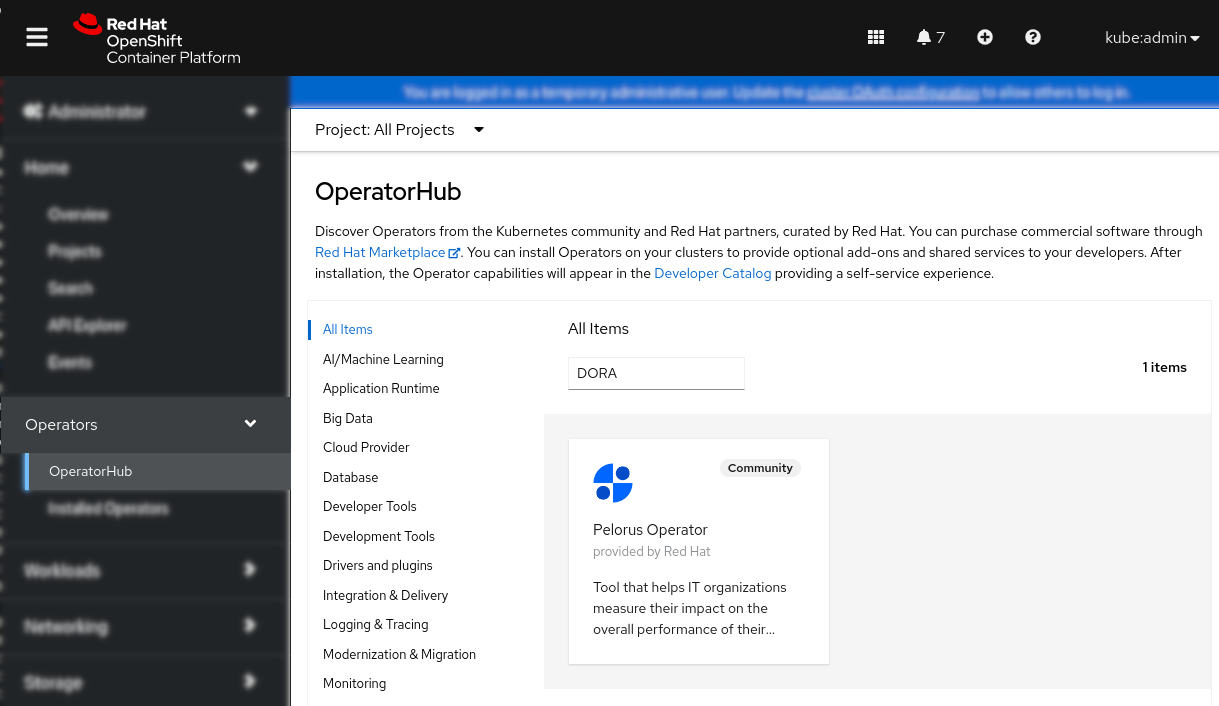
After logging in to the OpenShift Web console select OperatorHub from the Operators menu and search for Pelorus Operator by typing DORA, Dora metrics or Pelorus in the search field:
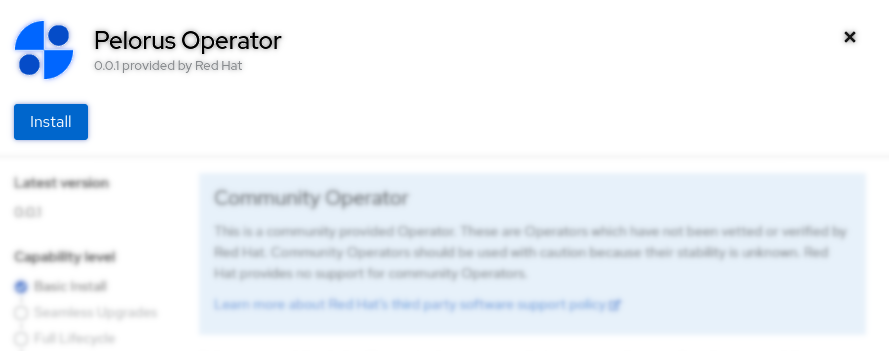
Next click on Install in the left top corner:
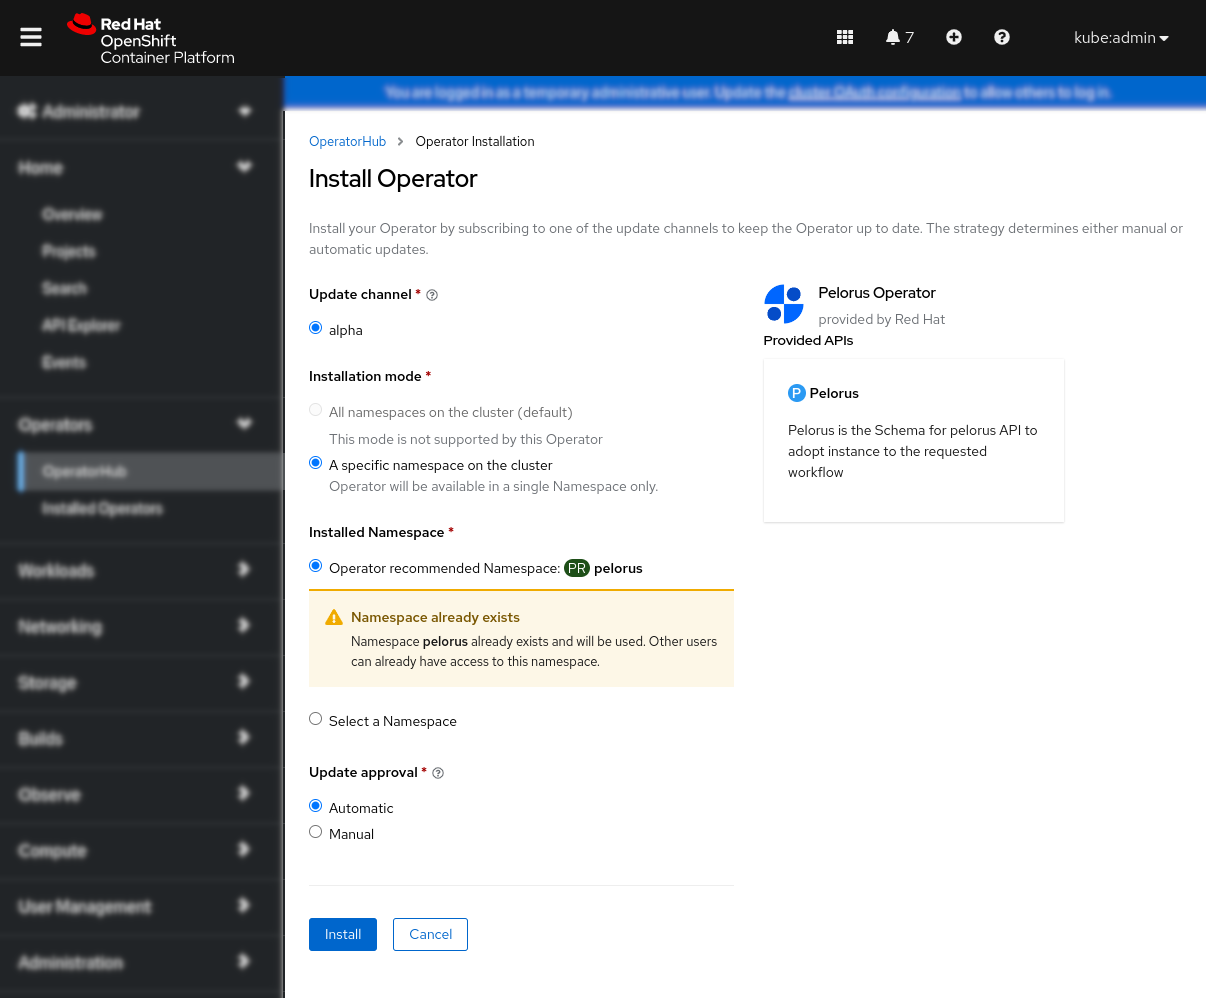
You can select OpenShift namespace to which Pelorus will be installed, then click Install. We recommend using default one, which is pelorus. This creates Pelorus Subscription in the given namespace.
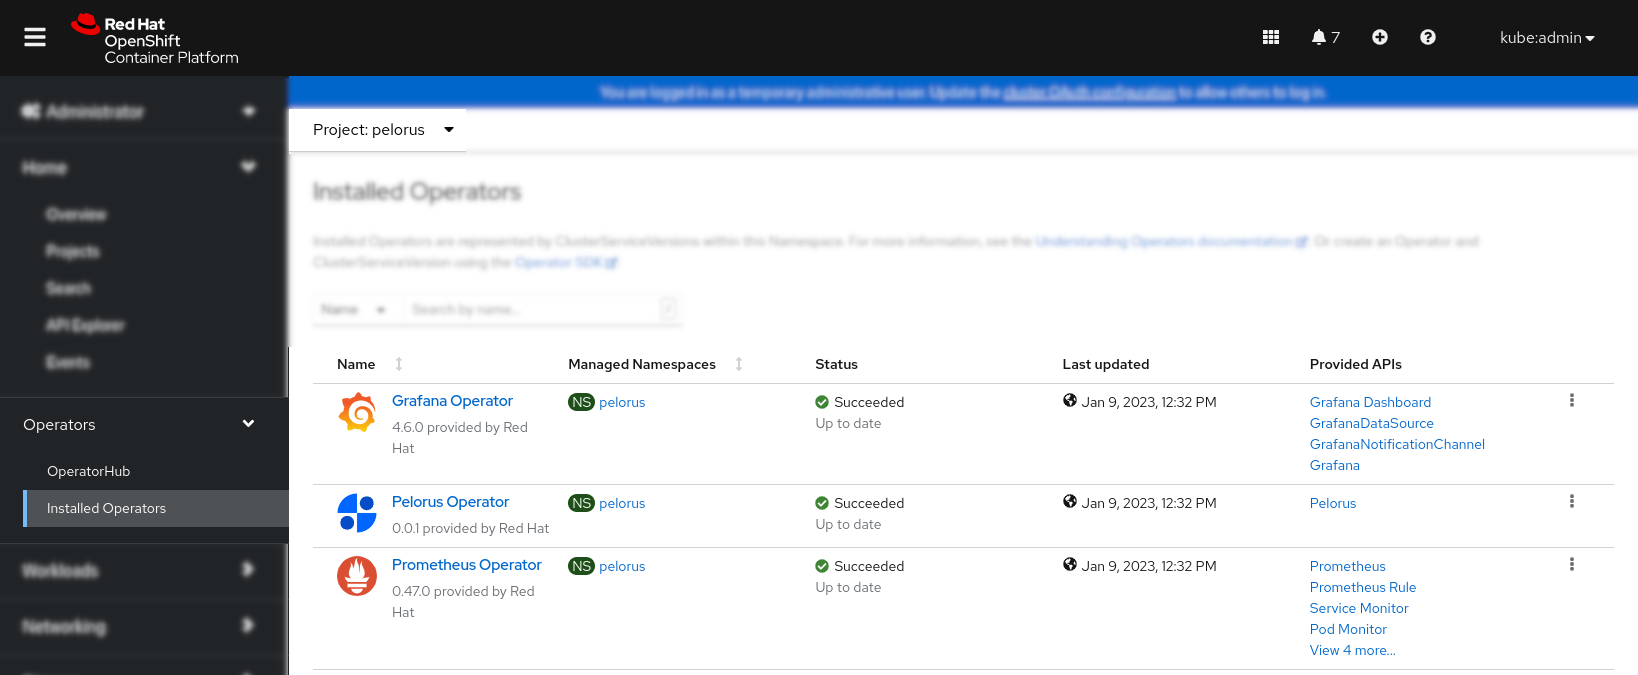
Verify that Pelorus, Grafana and Prometheus Operators are installed successfully by checking them under Installed Operators submenu:
Creating Pelorus instance
Note: Currently it is possible to create only one instance of Pelorus per cluster.
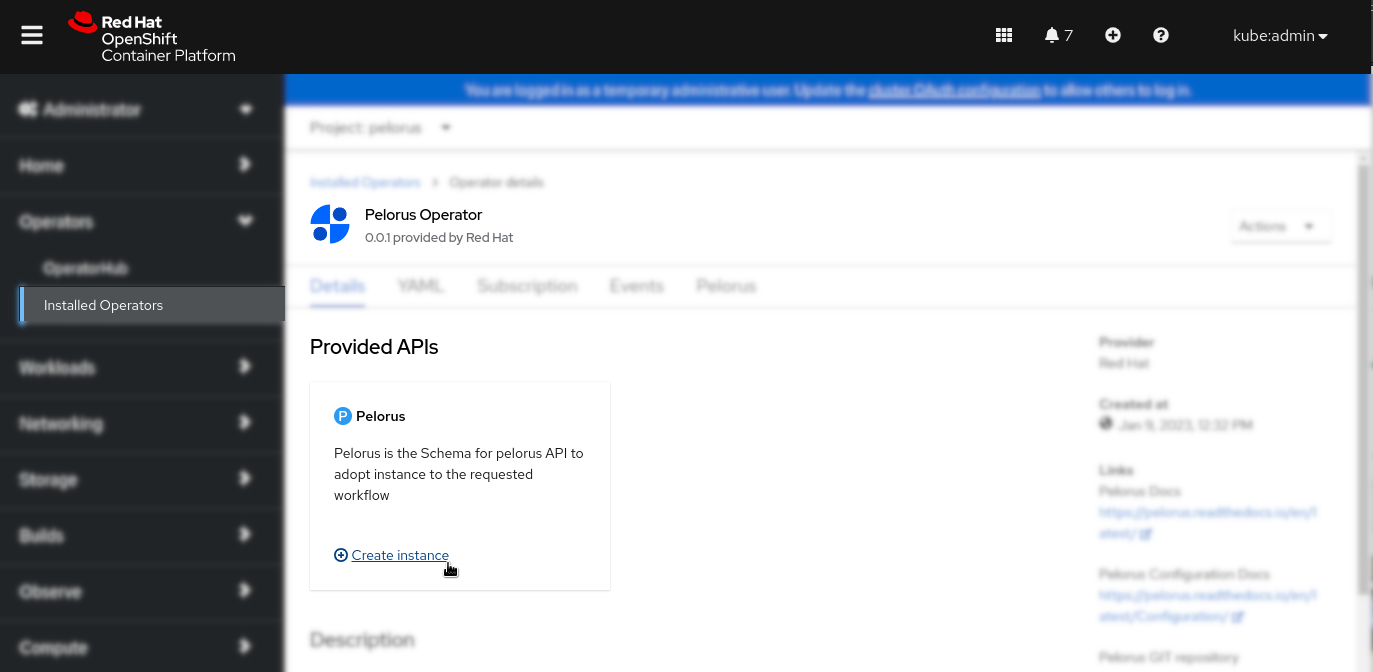
Click on the Pelorus Operator from the Installing Operator last step and then on the "Create instance" link:
Note: See the Pelorus Exporters Configuration Guide for more information on exporters and the Pelorus Core Configuration Guide to understand Pelorus core stack options before continuing.
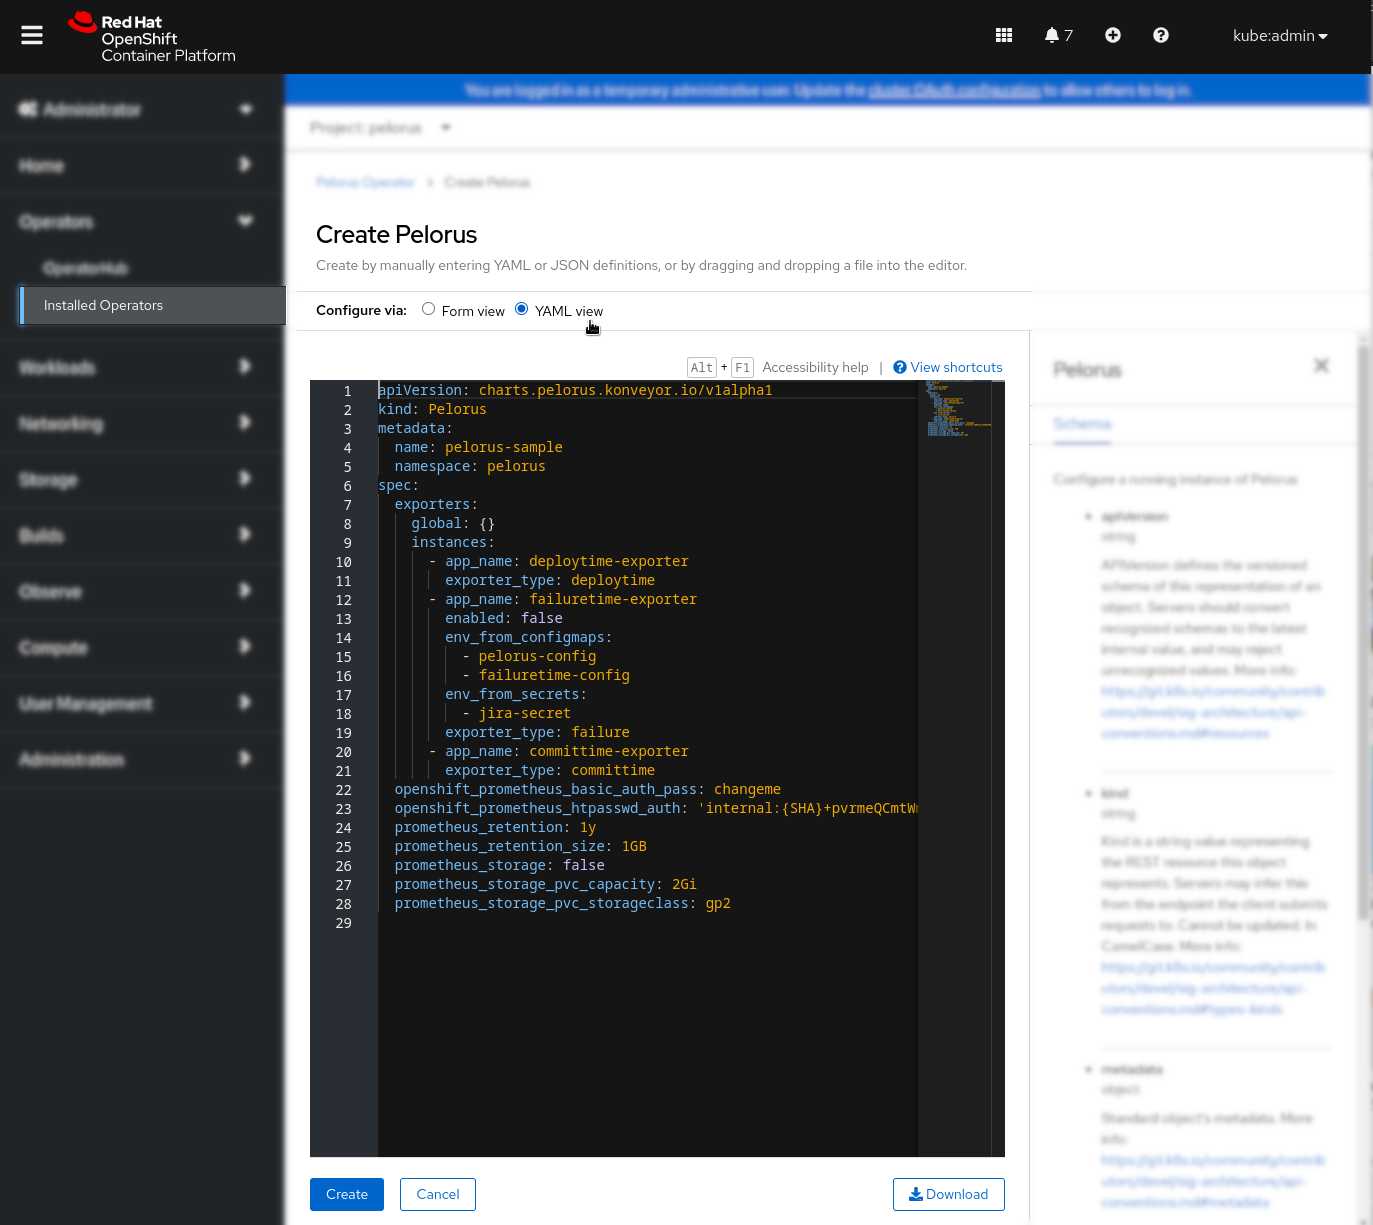
Click on the YAML view, which will open sample Pelorus object YAML, that should be adopted to the application workflow configuration of exporters, which are placed under instances: section and eventually additional configuration for the Pelorus core stack under spec: and click on the Create button:
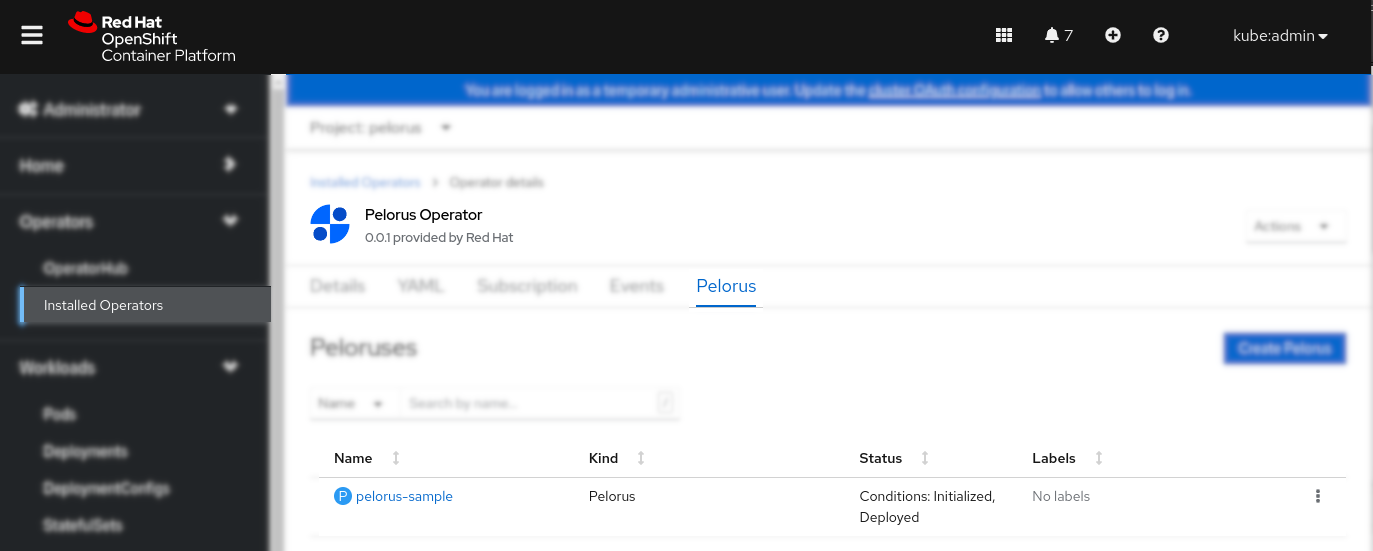
Verify Pelorus application deployment by selecting Pelorus tab from the Pelorus Operator view and ensuring the application has Deployed status. You may want to check more information about the Pelorus application deployment by clicking on the application name in the following picture pelorus-sample:
OpenShift Command Line Tool
Installing Operator
Installing Pelorus using CLI is equivalent to the OpenShift Web console method.
Create pelorus namespace. You can use other namespace to which Pelorus will be installed, but remember to adapt other installation and configuration steps to use that namespace. We do recommend using the default one, which is pelorus.
Create OperatorGroup object YAML file that uses pelorus namespace:$ cat > pelorus-operatorgroup.yaml <<EOF
apiVersion: operators.coreos.com/v1
kind: OperatorGroup
metadata:
name: pelorus-operatorgroup
namespace: pelorus
spec:
targetNamespaces:
- pelorus
EOF
$ cat > pelorus-operator-subscription.yaml <<EOF
apiVersion: operators.coreos.com/v1alpha1
kind: Subscription
metadata:
  name: pelorus-operator
  namespace: pelorus
spec:
  channel: alpha
  name: pelorus-operator
  source: community-operators
  sourceNamespace: openshift-marketplace
EOF
$ oc get sub pelorus-operator -n pelorus
NAME               PACKAGE            SOURCE                CHANNEL
pelorus-operator   pelorus-operator   community-operators   alpha
$ oc get csv -n pelorus
NAME                        DISPLAY               VERSION   REPLACES                    PHASE
grafana-operator.v4.8.0     Grafana Operator      4.8.0     grafana-operator.v4.7.1     Succeeded
pelorus-operator.v0.0.2     Pelorus Operator      0.0.2     pelorus-operator.v0.0.1     Succeeded
prometheusoperator.0.47.0   Prometheus Operator   0.47.0    prometheusoperator.0.37.0   Succeeded
Creating Pelorus instance
Note: Currently it is possible to create only one instance of Pelorus per cluster.
The Pelorus object YAML file requires specific to the application workflow configuration of exporters that are placed under instances: section and eventually additional configuration for the Pelorus core stack under spec:.
See the Pelorus Exporters Configuration Guide for more information on exporters and the Pelorus Core Configuration Guide to understand Pelorus core stack options.
(Example) Create Pelorus configuration object YAML file. In this example with two enabled exporters committime-exporter and deploytime-exporter, without prometheus persistent storage:
$ cat > pelorus-sample-instance.yaml <<EOF
kind: Pelorus
apiVersion: charts.pelorus.dora-metrics.io/v1alpha1
metadata:
  name: pelorus-sample
  namespace: pelorus
spec:
  exporters:
    global: {}
    instances:
      - app_name: deploytime-exporter
        exporter_type: deploytime
      - app_name: failuretime-exporter
        enabled: false
        env_from_configmaps:
          - pelorus-config
          - failuretime-config
        env_from_secrets:
          - jira-secret
        exporter_type: failure
      - app_name: committime-exporter
        exporter_type: committime
  openshift_prometheus_basic_auth_pass: changeme
  openshift_prometheus_htpasswd_auth: 'internal:{SHA}+pvrmeQCmtWmYVOZ57uuITVghrM='
  prometheus_retention: 1y
  prometheus_retention_size: 1GB
  prometheus_storage: false
  prometheus_storage_pvc_capacity: 2Gi
  prometheus_storage_pvc_storageclass: gp2
EOF
Once Pelorus configuration file is created e.g. pelorus-sample-instance.yaml apply it using:
Verify the pelorus-sample has been successfully created:
Verbose command to list Pelorus objects with their statuses, presenting successful Deployment with the InstallationSuccessful status:
$ oc get pelorus -n pelorus -o=jsonpath='{range .items[*]}{.metadata.name}{"\t"}{.status.conditions}{"\n"}{end}'
pelorus-sample    [{"lastTransitionTime":"2023-01-10T14:12:56Z","status":"True","type":"Initialized"},{"lastTransitionTime":"2023-01-10T14:13:00Z","reason":"InstallSuccessful","status":"True","type":"Deployed"}]
Deploying separate Pelorus exporters
It is valid scenario in which already existing Prometheus deployment may collect metrics from Pelorus exporters. In such case Pelorus exporter instances should be created separately and without it's OLM dependencies.
For such scenario we will use Helm to deploy exporters in separate namespace or separate cluster and later use additional configuration of Prometheus to receive data from those exporters.
Note: It is not required to install Pelorus Operator to deploy separate Pelorus exporter(s).
Initial steps
Please clone Pelorus repository and optionally create your desired namespace where you want the exporter(s) to be deployed. Those are the same steps as in the Initial Deployment up to the helm install [...], which in this scenario will be different.
Exporter(s) configuration file
The yaml configuration file for the separate Pelorus exporters should include only the instances section.
The Exporter(s) configuration part of the yaml file is exactly the same as for other methods used to create Pelorus instance. Please refer to the Pelorus Exporters Configuration Guide for more information on exporters.
Below is an example of such configuration file. It is important that all the ConfigMaps and Secrets are created in the namespace to which exporters will be deployed:
  $ cat > pelorus-sample-separate-exporters.yaml <<EOF
  instances:
    - app_name: deploytime-exporter
      exporter_type: deploytime
    - app_name: failuretime-exporter
      enabled: false
      env_from_configmaps:
        - pelorus-config
        - failuretime-config
      env_from_secrets:
        - jira-secret
      exporter_type: failure
    - app_name: committime-exporter
      exporter_type: committime
    - app_name: custom-exporter
      exporter_type: committime
      image_name: my.container.registry.io/pelorus/my-custom-exporter:latest
      env_from_secrets:
      - secret-credentials
      env_from_configmaps:
      - pelorus-config
      - custom-exporter-config
  EOF
Note: As in above example one of the exporters is using custom exporter image, that will be used by Pelorus to calculate DORA metrics. For more information on the custom exporters please check the Dev Guide.
Exporter(s) deployment
To deploy Pelorus Exporter(s) in the pelorus-sample namespace using previously created configuration file pelorus-sample-separate-exporters.yaml, simply run from the Pelrous source code directory:
$ helm install custom-exporters-deployment charts/pelorus/charts/exporters --namespace pelorus-sample --values pelorus-sample-separate-exporters.yaml
Note: To create another set of Pelorus exporters, either modify the configuration file and update the deployment within the same namespace or create new deployment in a new or separate namespace.
Accessing exporter
Exporter is available as an http endpoint, to get it's HOST/PORT, that should be used with Prometheus configuration simply get the routes for a given namespace:
$ oc get routes -n pelorus-sample
NAME                  HOST/PORT                                          PATH   SERVICES              PORT   TERMINATION   WILDCARD
deploytime-exporter   deploytime-exporter-pelorus-sample.apps.<DOMAIN>          deploytime-exporter   http                 None
failure               failure-pelorus-sample.apps.<DOMAIN>                      failure               http                 None
custom-exporter       custom-exporter-pelorus-sample.apps.<DOMAIN>              custom-exporter       http                 None
Updating Exporter(s) deployment
It is possible to update the deployment of the Pelorus exporter(s) with updated configuration file, to do so, simply run helm upgrade with the same custom-exporters-deployment as used in the installation, as follows:
$ helm upgrade custom-exporters-deployment charts/pelorus/charts/exporters --namespace pelorus-sample --values new-pelorus-sample-separate-exporters.yaml
Uninstalling Exporter(s) deployment
Cleaning up the Pelorus exporter(s) is very simple. Just run the helm uninstall with the deployment NAME used previously:
To list all the deployments created by Helm in all namespaces, use:
$ helm list -A
NAME            NAMESPACE               REVISION    UPDATED                                 STATUS      CHART           APP VERSION
my-exporters    pelorus-sample          1           2023-02-09 13:08:55.577034402 +0100 CET deployed    exporters-2.0.5
exporters       second-namespace        1           2023-02-09 14:23:33.854498266 +0100 CET deployed    exporters-2.0.5
Helm Charts
It is possible to install Pelorus from the source code using Helm charts. To do so, you will need tools on your system listed in the Prerequisites section.
When Pelorus gets installed via helm charts, the first deploys the operators on which Pelorus depends, the second deploys the core Pelorus stack and the third deploys the exporters that gather the data. By default, the below instructions install into a namespace called pelorus, but you can choose any name you wish.
Initial Deployment
To begin, clone Pelorus repository. To do so, you can run
which will download the latest code of Pelorus.To download a stable version, run
changing TAG by one of Pelorus versions.Change the current directory to pelorus, by running
Login to the OpenShift cluster as an admin, by running oc login command.
Create the namespace called pelorus that Pelorus will use, by running
Pelorus gets installed via helm charts. First, deploy the operators on which Pelorus depends, by running
Wait for the operators install to complete.
$ oc get pods --namespace pelorus
NAME                                                   READY     STATUS    RESTARTS   AGE
grafana-operator-controller-manager-................   2/2       Running   0          22s
prometheus-operator-................                   1/1       Running   0          10s
Then, deploy the core Pelorus stack, by running
Wait for the Pelorus install to complete.
$ oc get pods --namespace pelorus
NAME                                                   READY   STATUS      RESTARTS      AGE
committime-exporter-1-deploy                           0/1     Completed   0             43s
committime-exporter-1-.....                            1/1     Running     0             40s
deploytime-exporter-1-.....                            1/1     Running     0             40s
deploytime-exporter-1-deploy                           0/1     Completed   0             43s
grafana-deployment-................                    2/2     Running     0             34s
grafana-operator-controller-manager-................   2/2     Running     0             2m5s
prometheus-operator-................                   1/1     Running     0             111s
prometheus-prometheus-pelorus-0                        3/3     Running     1 (40s ago)   44s
prometheus-prometheus-pelorus-1                        3/3     Running     1 (39s ago)   44s
In a few seconds, you will see a number of resourced get created. The above commands will result in the following being deployed:
- Prometheus and Grafana operators
- The core Pelorus stack, which includes:
- A
Prometheusinstance - A
Grafanainstance - A
ServiceMonitorinstance for scraping the Pelorus exporters. - A
GrafanaDatasourcepointing to Prometheus. - A set of
GrafanaDashboards. See the Outcomes (Dashboards) documentation for more details.
- A
- The following exporters:
- Deploy Time
- Commit Time
To check this, run
From here, some additional configuration is required in order to deploy other exporters. See the Pelorus Exporters Configuration Guide for more information on exporters.
You may also want to enabled other features for the core stack. See the Pelorus Core Configuration Guide to understand those options.
To understand how to set up an application to Pelorus to watch, see QuickStart tutorial.
Uninstalling
Cleaning up Pelorus is very simple. Just run
If Pelorus was deployed with PVCs, you may want to delete them, because helm uninstall will not remove PVCs. To delete them, run