Architecture
Basic Architecture and Components
The following diagram shows the various components and traffic flows in the Pelorus ecosystem.
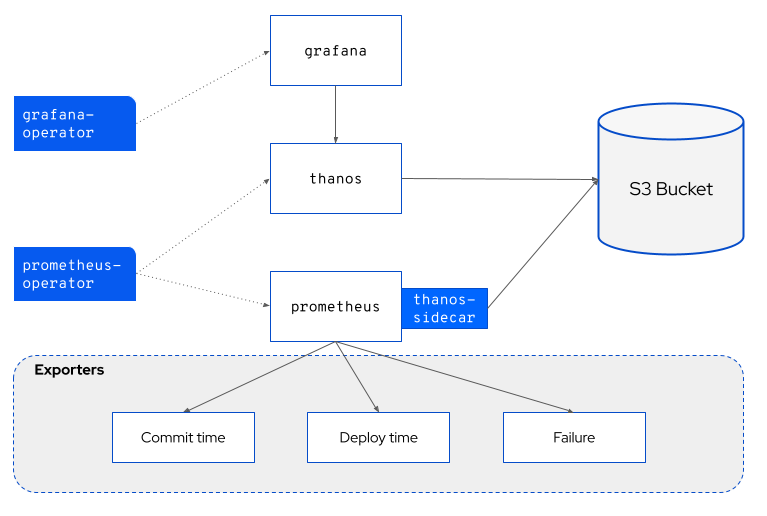
Pelorus is composed of the following open source components.
- Prometheus Operator
- Prometheus
- Thanos (backed by Object Store)
- Grafana Operator
- Grafana
- Pelorus Exporters
- Commit Time
- Deploy Time
- Failure
- Webhook
Prometheus and Grafana
Pelorus is built on top of Prometheus and Grafana, an industry standard open source metrics gathering and dashboarding stack. This allows for us to focus on the core differentiators for Pelorus - the metrics we care about, methods of gathering then, and building information radiators from those metrics.
Thanos is a set of Prometheus components that provide high availability and long term storage of Prometheus data. We use Thanos in Pelorus to give our dashboards the ability to look back over months or years of organizational data.
Pelorus Exporters
An exporter is a Prometheus concept of a bot that gathers and exposes data. Pelorus uses the exporter framework to build integrations with a myriad of common IT systems from which we can then gather the relevant data for our dashboards. Webhook is a special type of exporter that uses push method to receive data from 3rd party systems and exposes it to the Prometheus.
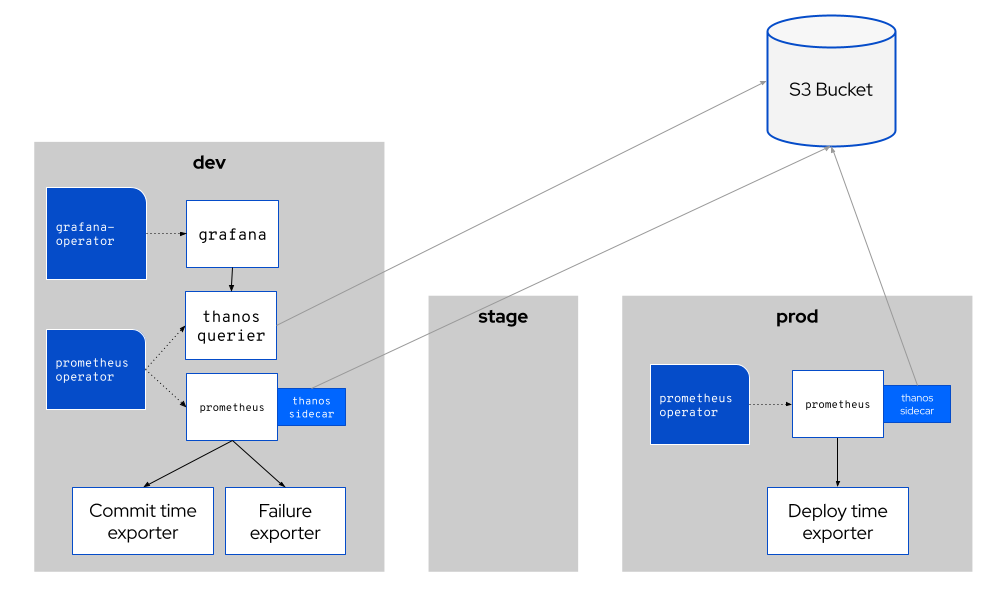
Multi-Cluster Architecture (Production)
In production environments, Pelorus will typically need to be installed across multiple kubernetes clusters. In most cases, the two clusters that matter are the "Development" cluster (where builds are happening)