Welcome to Pelorus
![]()
![]()
Pelorus is a tool that helps IT organizations measure their impact on the overall performance of their organization. It does this by gathering metrics about team and organizational behaviors over time in some key areas of IT that have been shown to impact the value they deliver to the organization as a whole. Some of the key outcomes Pelorus can focus on are:
- Software Delivery Performance
- Product Quality and Sustainability
- Customer experience
For more background on the project you can read @trevorquinn's blog post on Metrics Driven Transformation
Software Delivery Performance as an outcome
Currently, Pelorus functionality can capture proven metrics that measure Software Delivery Performance -- a significant outcome that IT organizations aim to deliver.
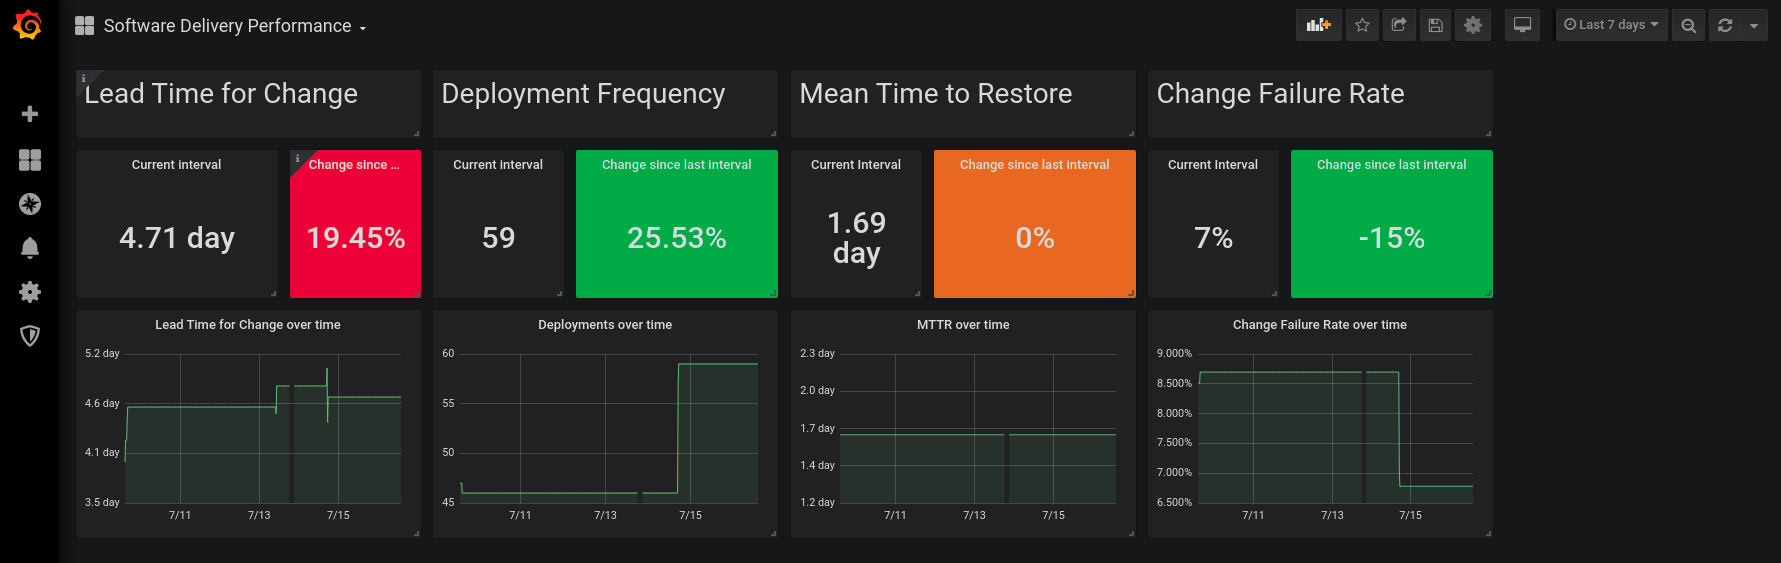
Pelorus is a Grafana dashboard that can easily be deployed to an OpenShift cluster, and provides an organizational-level view of the four critical measures of software delivery performance.
A short video describing each of these metrics is available here.
Prior Knowledge
In order to be successful deploying, managing and consuming Pelorus, the following prior knowledge is required:
- Understanding of Software Development Life Cycle.
- Understanding of Kubernetes Operators.
- Understanding of helm.
- Understanding of source version control systems: Git.
- Understanding of OpenShift Builds and Pipelines.
- OpenShift administrator knowledge & permissions.
- Understanding of Cloud Native monitoring tools: Prometheus & Prometheus Exporters, Thanos and Grafana.
- Understanding of software development project tracking tools: Jira.