Welcome to Pelorus
![]()
![]()
Pelorus is a tool that helps IT organizations measure their impact on the overall performance of their organization. It does this by gathering metrics about team and organizational behaviors over time in some key areas of IT that have been shown to impact the value they deliver to the organization as a whole. Some of the key outcomes Pelorus can focus on are:
- Software Delivery Performance
- Product Quality and Sustainability
- Customer experience
To understand the motivation, see Our Philosophy.
For more background on the project you can read @trevorquinn's blog post on Metrics Driven Transformation.
Software Delivery Performance as an outcome
Currently, Pelorus can capture proven metrics that measure Software Delivery Performance -- a significant outcome that IT organizations aim to deliver.
Pelorus is a Grafana dashboard that can easily be deployed to an OpenShift cluster, and provides an organizational-level view of the four critical measures of software delivery performance.
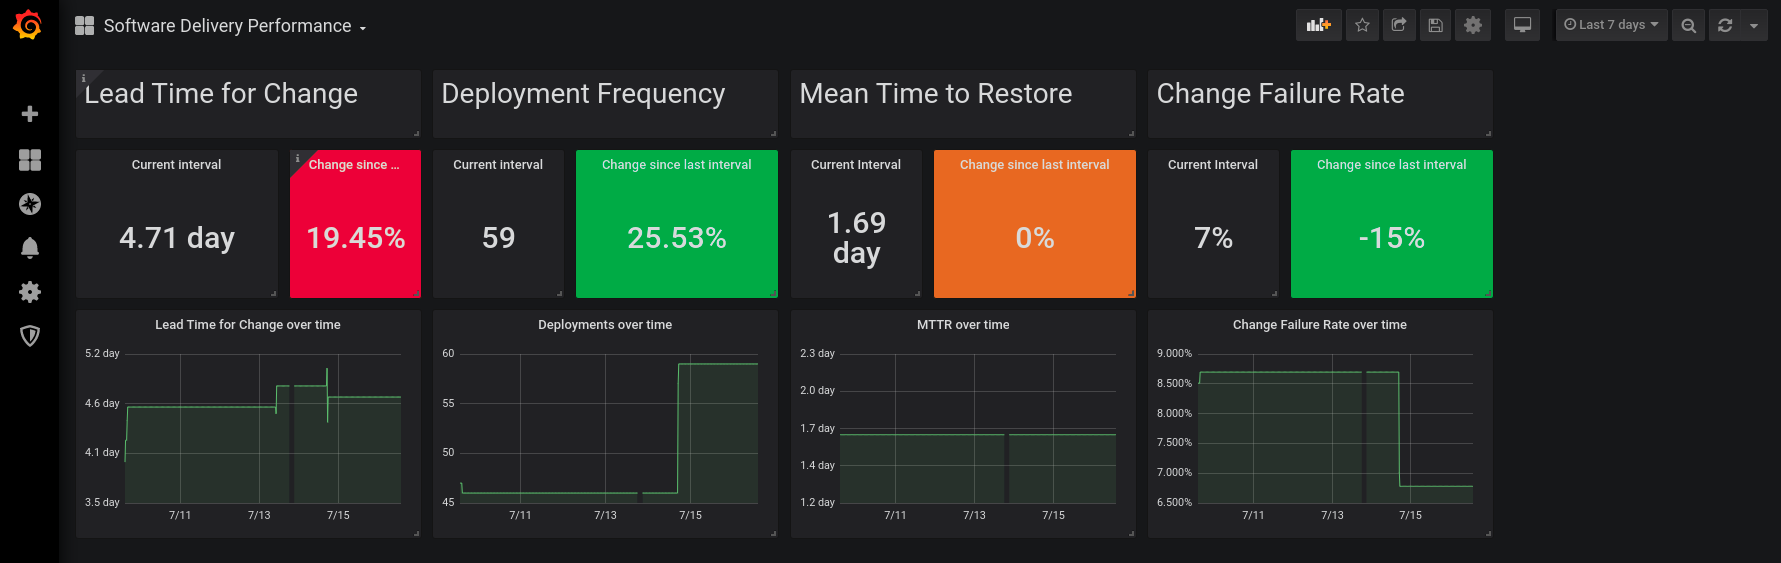
A short video describing each of these metrics is available here, and you can learn more about each individual dashboard in the dashboards documentation.
Prior Knowledge
In order to be successful deploying, managing and consuming Pelorus, the following prior knowledge is required:
- Understanding of Software Development Life Cycle.
- Understanding of Kubernetes Operators.
- Understanding of helm.
- Understanding of source version control systems: Git.
- Understanding of OpenShift Builds and Pipelines.
- OpenShift administrator knowledge & permissions.
- Understanding of Cloud Native monitoring tools: Prometheus & Prometheus Exporters, Thanos and Grafana.
- Understanding of software development project tracking tools: Jira.
The Name
A Pelorus is a navigation device on a ship that indicates relative direction. So, instead of telling you where North is, like what a compass would do, a pelorus tells you where you are heading by relating it to the direction you originally set off.
A transformation journey is unique for every organization, every team, and every individual. This is because no two transformation journeys begin at the same point. Even across varying teams within the same organization, there are variances in skillset, experience and context that impact what the journey will look like. Additionally, transformation isn't about reaching a destination. It's about continually solving problems that are impeding improvements. As organizations align on improving certain outcomes and setting goals, you can use Pelorus to help identify what goals to focus on and watch trends change as you continue to invest in improvements.
With this in mind, we hope that you use Pelorus to guide your transformation journey in a way that's best for you.
Logo & Branding
![]()
Abstract rectangles and circles represent the various pieces of data collected in the Pelorus dashboard, open for interpretation by the user.
![]()
In situations where there is limited space to include a visual, the Pelorus icon could be used represent the tool.